Europe's deadliest countries for driving in 2026
Serbia once again tops the list of the most dangerous European countries for driving, with 74 road deaths per million inhabitants in 2025.
Bulgaria and Romania rank second and third, with road fatality rates of 71 and 68 deaths per million inhabitants, respectively.
Norway and Sweden tie as Europe's safest countries for drivers, with just 19 road deaths per million inhabitants
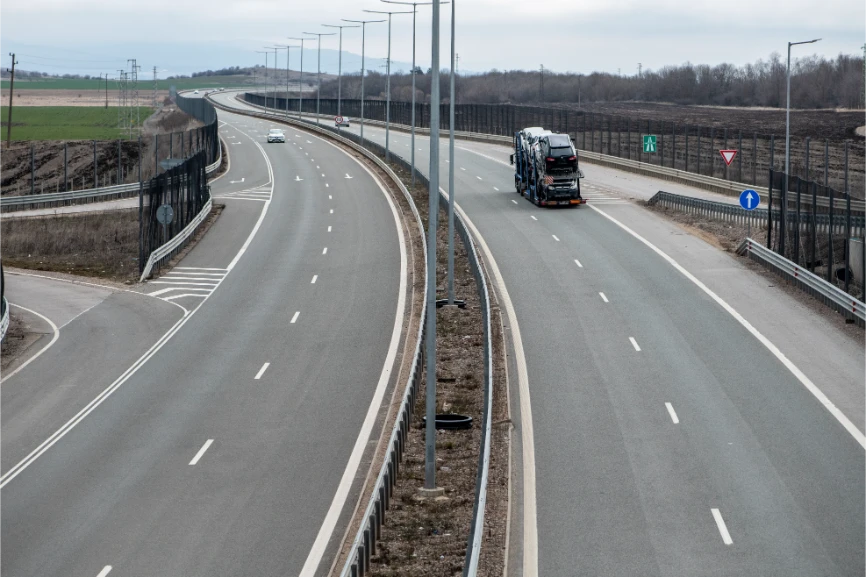
Driving across Europe offers some of the most scenic routes in the world. However, safety standards on those roads vary wildly from border to border.
VignetteSwitzerland.com’s latest study revealed that Serbia is once again the most dangerous country for drivers in Europe, retaining its spot for two consecutive years now.
Following our comprehensive reports on the most dangerous European countries to drive in 2024 and 2025, we have analyzed the latest data from the newly released 2026 PIN (Performance Index) road safety report. The latest report compares road safety across European countries, ranking nations based on their 2025 road fatality figures.
The Top 10 Deadliest European Countries for Driving in 2026
| Rank | Country | Road Deaths | Population | Deaths Per Million | % Above EU Average | Road Deaths % Change Since 2015 |
|---|---|---|---|---|---|---|
| 1 | Serbia | 488 | 6,567,783 | 74 | 72% | -19% |
| 2 | Bulgaria | 456 | 6,437,360 | 71 | 65% | -36% |
| 3 | Romania | 1,296 | 19,043,151 | 68 | 58% | -32% |
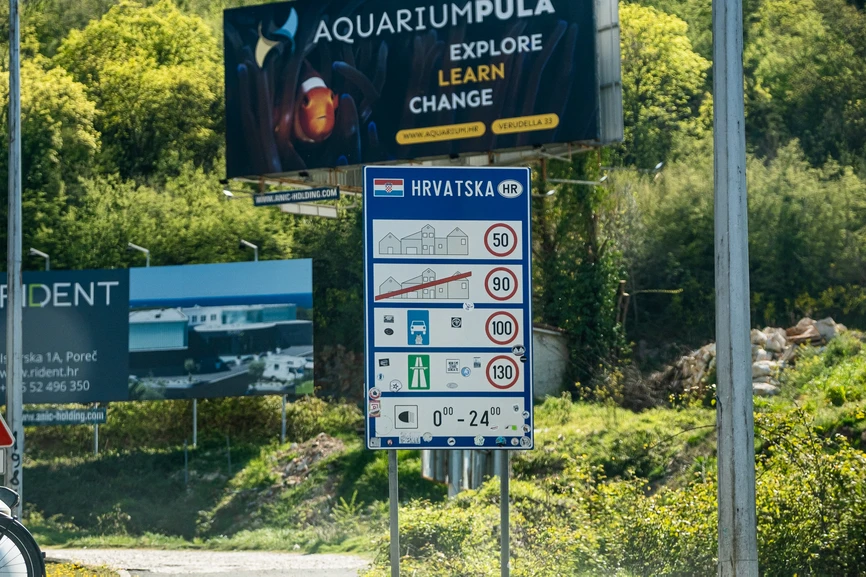
| 4 | Croatia | 261 | 3,874,350 | 67 | 56% | -25% |
| 5 | Latvia | 118 | 1,860,565 | 63 | 47% | -37% |
| 6 | Portugal | 589 | 10,749,635 | 55 | 28% | -1% |
| 7 | Greece | 517 | 10,372,335 | 50 | 16% | -35% |
| 8 | Italy | 2,897 | 58,943,464 | 49 | 14% | -16% |
| 8 | France | 3,263 | 66,578,547 | 49 | 14% | -6% |
| 10 | Lithuania | 138 | 2,890,664 | 48 | 12% | -43% |
| 10 | Hungary | 454 | 9,539,502 | 48 | 12% | -30% |
Serbia claims the unfortunate title of Europe's deadliest country for drivers. With 488 total road deaths captured during the study period, Serbia experiences 74 road deaths per million inhabitants. This puts the country a staggering 72% above the current EU average. However, its latest road fatality figures are slightly down from last year’s.
Bulgaria follows closely in second place with 71 deaths per million. While the country was up by one spot from its ranking previously, its road fatality figures are also slightly lower compared to the previous year.

Romania takes third place this year with 68 deaths per million. Romania placed second last year with 77 road deaths per million residents.
Croatia (67 deaths per million) and Latvia (63 deaths per million) round out the top five most dangerous driving destinations on the continent. Both are up from last year’s rankings.
Popular holiday destinations Portugal and Italy still ranked prominently in this year’s dangerous driving rankings, logging 55 and 49 road deaths per million residents.
Notably, Norway and Sweden are tied as Europe’s safest driving nations, with just 19 road deaths per million residents. Norway held the same position in last year’s ranking, although it recorded a slightly higher road fatality figure this year.
Trailing behind Norway and Sweden are the United Kingdom and Denmark, which are tied in the 28th spot, with 23 road deaths per million residents.
Switzerland also follows closely with 24 road deaths per million residents.
Year-Over-Year Trends: Who is Improving?
Because we track these statistics annually, looking at the percentage change in road deaths since 2015 reveals the real long-term stories in European road safety. The total number of fatalities only tells half the story. The historical trends show us who is actively making their roads safer.
Lithuania is a massive standout success. While it still ties for 10th place in the current rankings, the country has achieved an incredible 43% reduction in road deaths over the last decade. Latvia (down 37%), Bulgaria (down 36%), Greece (down 35%) and Hungary (down 30%) are also showing excellent long-term progress in protecting drivers and pedestrians alike.
On the other end of the spectrum, progress has severely stalled in several major tourist destinations. Portugal, ranking 6th on our list, has seen a mere 1% decrease in road deaths since 2015. This stagnation is a major red flag for local authorities. France also shows a very slow rate of improvement, reducing its road fatalities by just 6% over the same timeframe.
Mattijs Wijnmalen, Executive Officer at VignetteSwitzerland.com comments:
"The findings from this newly released 2026 PIN report paint a stark and concerning picture of the severe safety discrepancies drivers face across Europe today. Seeing Serbia top the list at 72% above the EU average, closely followed by Bulgaria and Romania, highlights a persistent infrastructure and road safety crisis in Eastern Europe that demands urgent regulatory attention.
However, what is perhaps most eye-opening about this new dataset is that the danger is not confined to developing transit networks. Major Western European tourism hubs like Italy and France are tied in eighth place, sitting with road fatality rates 14% higher than the current EU average benchmark.
By tracking these safety metrics annually, we are able to separate the nations making genuine, life saving structural changes from those where driver safety has completely flatlined. Lithuania serves as a brilliant blueprint for success here, showcasing a massive 43% drop in road deaths since 2015 through stricter enforcement and modern road designs. Conversely, the fact that Portugal has achieved a mere 1% reduction in fatalities over the exact same ten-year timeframe is a major red flag for local transport authorities.
For anyone planning to rent a vehicle or embark on a European road trip this year, this new data serves as a critical reminder that road quality and traffic safety change the moment you cross a border. Staying informed and adjusting your driving habits to local conditions is an absolute necessity."
Data Sources:
European Transport Safety Council (ETSC) PIN Report and internal Vignette Switzerland yearly analysis.
Methodology:
This study ranks countries based on their road fatality figures for 2025, using data from the European Transport Safety Council's (ETSC) Performance Index (PIN) 2026 report. Percentages were rounded to the nearest whole number.
Data is correct as of June 2026.
Deadliest European Countries for Driving in 2026 (Full Table):
| Rank | Country | Road Deaths | Population | Road Deaths Per Million Residents | Difference to EU Average |
|---|---|---|---|---|---|
| 1 | Serbia | 488 | 6,567,783 | 74 | 72% |
| 2 | Bulgaria | 456 | 6,437,360 | 71 | 65% |
| 3 | Romania | 1,296 | 19,043,151 | 68 | 58% |
| 4 | Croatia | 261 | 3,874,350 | 67 | 56% |
| 5 | Latvia | 118 | 1,860,565 | 63 | 47% |
| 6 | Portugal | 589 | 10,749,635 | 55 | 28% |
| 7 | Greece | 517 | 10,372,335 | 50 | 16% |
| 8 | Italy | 2,897 | 58,943,464 | 49 | 14% |
| 8 | France | 3,263 | 66,578,547 | 49 | 14% |
| 10 | Lithuania | 138 | 2,890,664 | 48 | 12% |
| 10 | Hungary | 454 | 9,539,502 | 48 | 12% |
| 12 | Cyprus | 45 | 982,966 | 46 | 7% |
| 13 | Poland | 1,660 | 36,497,495 | 45 | 5% |
| 14 | Austria | 403 | 9,197,213 | 44 | 2% |
| 14 | Czechia | 475 | 10,909,500 | 44 | 2% |
| 16 | Slovenia | 92 | 2,130,850 | 43 | 0% |
| 17 | The Netherlands | 759 | 18,044,027 | 42 | -2% |
| 17 | Slovakia | 227 | 5,421,349 | 42 | -2% |
| 19 | Luxembourg | 27 | 682,050 | 40 | -7% |
| 20 | Belgium | 445 | 11,883,495 | 37 | -14% |
| 20 | Malta | 21 | 574,250 | 37 | -14% |
| 22 | Spain | 1,777 | 49,128,297 | 36 | -16% |
| 23 | Finland | 193 | 5,635,971 | 34 | -21% |
| 23 | Ireland | 183 | 5,440,278 | 34 | -21% |
| 23 | Germany | 2,814 | 83,577,140 | 34 | -21% |
| 26 | Estonia | 43 | 1,369,995 | 31 | -28% |
| 27 | Switzerland | 214 | 9,051,029 | 24 | -44% |
| 28 | Denmark | 136 | 5,992,734 | 23 | -47% |
| 28 | United Kingdom | 1,612 | 69,200,000 | 23 | -47% |
| 30 | Sweden | 203 | 10,587,710 | 19 | -56% |
| 30 | Norway | 106 | 5,594,340 | 19 | -56% |